
I would like to thank Ankara University and Pinar Dag for inviting me to speak on Data Journalism, and how it´s helping us shape a different future in communication. My name is Hassel Fallas, I´m from Costa Rica and I´ve been a journalist for fifteen years. Currently, I´m the data editor at La Nación newspaper, one of the pioneer enterprises in Data Journalism in Latin America.
For me, it´s an honor and a pleasure to share my time with young people like you, hungry for innovation and daring to face the challenges that the new context of journalism is imposing on us.
So, let me start with two questions:
- Have you ever thought of what will make you different from other journalists when you finish college and join the real world?
- What are the skills that will give you an advantage over others to get a job in a newsroom, or even better, establish your own news start up or get a scholarship that will help you achieve your goals?
Don´t worry if you´re not clear about your future. I´m still in that process.
When we hear the word FUTURE we feel like Cooper, the pilot in the Interstellar movie, when he travels inside the Gargantua black hole.
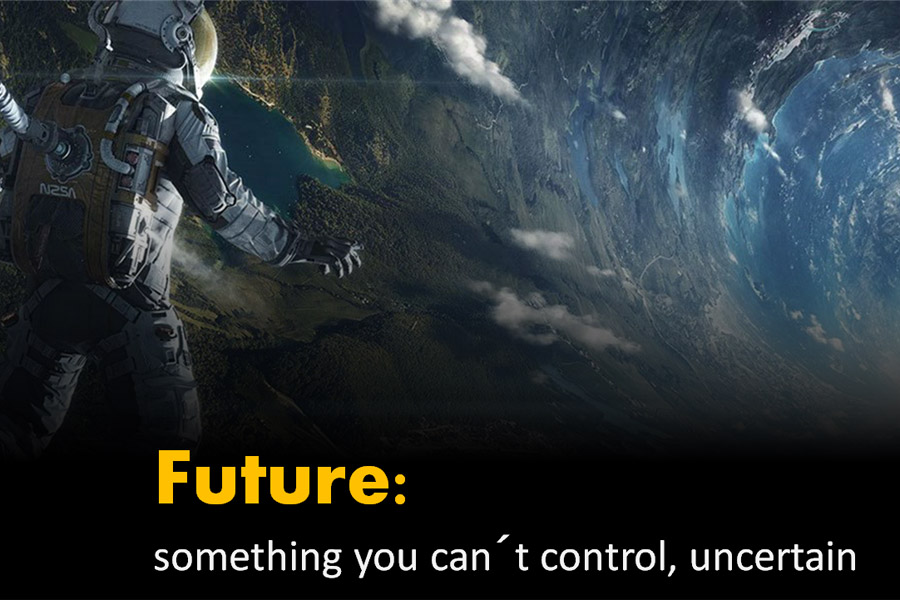 Future is a very disturbing word because we often think of it as something we can control. Well, I´m sorry to tell you that´s very unlikely, although there´s something we can do to reduce the anxiety caused by the unknown: invent our own future.
In nineteen seventy-two, Alan Kay, the computer engineer said:
“The best way to predict the future is to invent it.”
I think he´s right. But creating something requires a high dose of courage, commitment, discipline, innovation, and tolerance towards frustration. In a nutshell: get out of your comfort zone or you will be swallowed up by the black hole of conformism.
And when I say comfort zone, I mean all those things that prevents you from growing and unleashing your potential.
So, what do you need to start inventing your future in journalism?
- First step: open your mind! Attending this kind of seminars really helps you be aware of new paths and meet people who are trying to do innovating things, improve journalism, and share ideas to mold them into a concrete project.
Opening your mind also implies overcoming deeply rooted beliefs and prejudices. For instance: I´m not good with numbers.
I know numbers are a big headache, but what is really horrible is not knowing what to do with them.
Aron Pilhofer, Executive editor of digital at the Guardian in London, explains it better:
«Journalism is one of the few professions that not only tolerates general innumeracy, but celebrates it. I still hear journalists who are proud of being math illiterate, even though programming is about logic. It’s hard to get a journalist to open up a spreadsheet, much less open a command line. It´s something they don´t see as an important skill… It’s a cultural problem»
The fear of numbers is one of the worst comfort zones where a journalist can fall. But at this point, I believe that all of us are convinced that math, spreadsheets, and code are fundamental skills to invent a bright future for journalism.
Today, numbers are a mine of gold for journalists who know what to do with big data, open data movements, scrap data, or create their own data sets. But just like a miner, you need tools, equipment to extract that gold and present it in attractive ways to your audience.
That´s why I wish I could leave a thirst for knowledge and curiosity and make you wonder how data journalism can help you grow as a professional.
Here is one of my favorite definitions of what Data Journalism is:
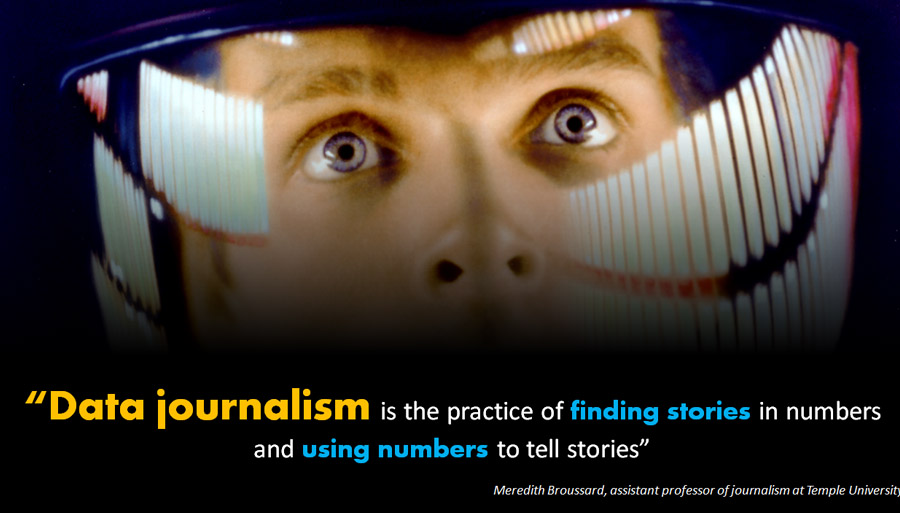
And those numbers can be large or small datasets; it all depends. What I loved about this definition is the part of numbers and telling. They are like Siamese twins because they can´t be without each other.
Remember this: data is not about staying behind your desk with the computer; the best thing you can do is go out into the real world and find out how numbers impact people´s lives.
Data journalism is just another tool that investigative journalism has for unveiling corruption and protecting the public interest. It strengthens the investigative capacity, empowers watchdogs with new tools, and allows innovation.
How does it allow innovation? Because you constantly find new software or tools for data visualization, new ways of multimedia narrative and, basically, because every data journalism project is different and will need to develop a creative problem-solving procedure.
What are the stages of data journalism?
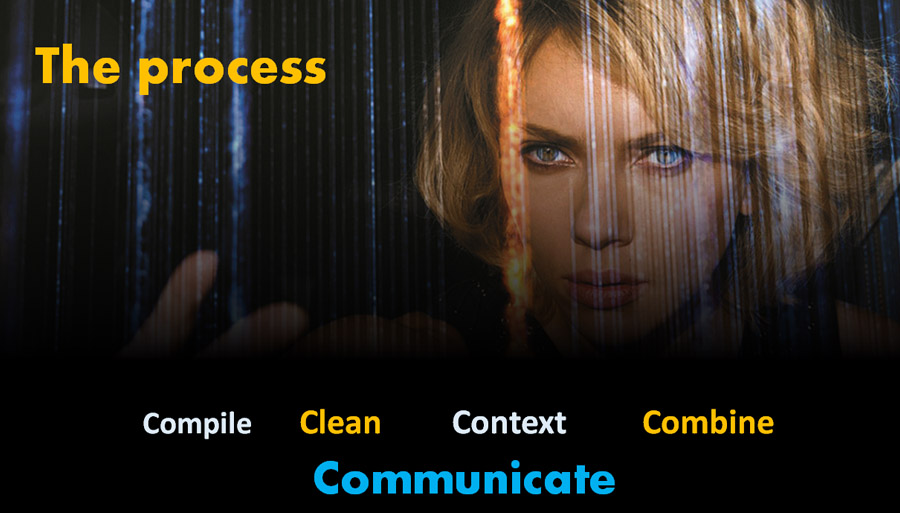
Compile: there are several ways to get the data you need: you can get a dataset from an organization or the government, find it in open data websites, or download them from Internet. You can also extract data by using different software or collect it yourself through surveys or interviewing people.
Clean: this is the process that let us sleep peacefully at night. Why? Because it ensures that you don´t have errors in your data. Some typical errors could be: duplicating entries, misspelling names, blank spaces, or typos in figures. It´s the quality assurance of your data and the basis of your analysis.
Context: it consists of doing research over your data: where does data come from?
- How reliable is the information?
- Is it complete?
- Are there any missing parts, why?
- How was this data collected? What was the method used?
- Does it provide me all the information I need? Do I have to look for any other datasets or even build my own?
These steps can lead you to compile additional data. You can have the number of crimes in all the cities of your country but you need to know the population in every one of them in order to estimate rates and determine in which cities crime is really a big concern.
Combine: you can work with only one dataset, but what is really fantastic is combining databases to increase the context and possibilities to extract journalistic information to tell a story.
Think of a dataset with the number of dropouts in every Turkey high school and combine it with two other databases: unemployment and poverty rates in every district of your country.
Imagine that after the data analysis, you found a cluster of schools that are doing very well with low dropout percentages, even if they have high rates of poverty in the community. You could go deeper and investigate what plans are being implemented in those schools.
What happens with those students when they leave high school? You could find patters of inequity and show them in an interactive way that leads you to the last stage of Data Journalism: communicating the results to the audience.
Communicate: this includes: data visualization, infographics, interactive apps, but most important of all, how you´re going to tell the story, what human approach you´re going to use, and which is the best human story that data helped you get.
At this time, you can say: ufff, data journalism is not only time-consuming but intensive and demanding, but believe me: it´s always rewarding. You don´t have to do it alone. Actually, one of the greatness of Data Journalism is teamwork, without it there are no successful projects.
You can do Data Journalism if you:
- Teamwork, no more lonely wolves. It´s great to share your ideas with other fellows, become friends with engineers, programmers, statisticians, economists, designers, and invite to the data journalism journey anyone who can help you achieve excellence and holistic knowledge on the digital reality were facing today.
- Lose your math phobia
- Critical thinking
- Good nose
- Discipline and persistence
I would like to say that the best way to do data-driven journalism is simply to start. When you get started, there´s nothing to lose; on the contrary, you gain experience and knowledge for your personal growth and improve the quality of the journalism you´re practicing.
In this respect, my piece of advice is the one given by the philosopher René Descartes:

Pick a topic you are passionate about, look for data, share your idea with others, ask for help and don´t give up; sooner or later you will unlock your data potential.
At the end of this seminar, go to your computer, open a spreadsheet (google, Excel, open office) and start practicing. Those programs are a good reference to go from the most basic analysis to the most sophisticated one. Remember: practice makes perfect.
Here there are some Excel tutorials that can be very useful to you
It´s pretty common that when we acquire expertise in something, we don´t want to move from there. This is the kind of comfort zone we should avoid. My recommendation is don´t die in Excel. At the moment you develop basic skills in spreadsheets it´s time to jump to Statistics.
Statistics is essential to give sense to your data and support your story by using numbers in a simple and clear way. As journalists, we are committed to search for the truth and present accurate information to the public.
One more tip to do data journalism: mix the good stuff. As I said before, don´t die in Excel; open your mind to any other software or tool that allows you to grow in your data expertise. For example, you can do part of the analysis with Excel and simultaneously visualize conclusions with Tableau Public, Data Wrapper, or RAW.
Or, if you feel it´s the time to be bold and ambitious, try Access, a very useful tool to work larger volumes of data than Excel and understand the logic of queries in SQL (Structured Query Language)
Now, let´s see how all this good stuff works together in a data journalism project.
At the beginning of this conversation I said that I´m working as data editor in La Nación newspaper, and now I´m going to show you our latest project, which we called: Your career, your future.
This interactive special publication was created by using as basis thereof the analysis of a database containing the number of graduates from public and private universities from 107 different programs. We combined that group with the absolute and relative figures of unemployment and graduates working in areas not related to their profession, the gender of students and the average wage for people with a bachelor’s degree.
Of course this is journalism of service, which purpose is to be useful to those who are currently defining their future at college. In first place, we allow people to take control of the information, do their own research, and make data comparisons.Then, we show our own conclusions to finally create a tool for permanent consultation.
Regarding used technologies, those are: Excel, SQL, HTML, CSS, JQuery, SVG, SVG SMIL, Google Charts API, Google Spreadsheets, Abobe Creative Suit, Brackets.
We´re coming to the end of this presentation and I would like to finish sharing a thought from Sarah Cohen, the data editor at New York Times, recently given in Nicar conference I attended in Atlanta. She said:
“Define Data Journalism through techniques, not tools”
This means to me: don´t get married with any particular software. Remember that computers don´t change a bad reporter into a good one. What´s going to make you a better reporter is your hunger for learning, your ability to apply to your analysis all the necessary techniques to unveil situations that generate inequality, injustice, and corruption in our surroundings
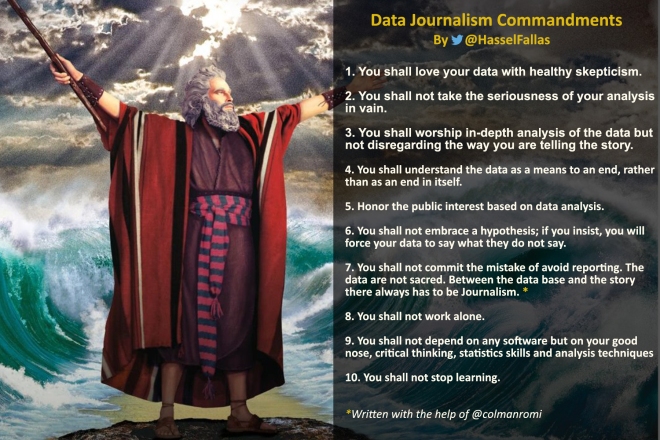
Finally, I would like to close up sharing with you my ten golden rules for Data Journalism: